 ·
4 minute read
·
4 minute read
When working with distributed systems, one of the biggest questions we usually ask ourselves is:
Will my application really survive when something unexpected happens?
Most of the time, we only get the answer after an issue occurs in production. Unfortunately, by then it's already too late. That's where Chaos Engineering comes in. The goal isn't to break your system for its own sake, but to understand how your applications behave when things go wrong in a controlled environment.
In this article, I'll walk through Chaos Mesh, one of the Chaos Engineering tools I've been using recently. We'll install it and go through a few simple scenarios to see how it works.
What is Chaos Mesh?
What I liked when I first started using it was that I didn't have to learn another platform or a new way of defining experiments. If you've written Kubernetes manifests before, creating a chaos experiment feels no different - it's just another YAML resource.
Why Chaos Mesh?
Several Chaos Engineering tools are available today, but Chaos Mesh stands out for a few reasons.
Dashboard
One thing I really like is the dashboard. You can:
- Create new chaos experiments
- Monitor running experiments
- Review experiment results
- Stop experiments whenever needed
If you prefer a graphical interface instead of only using kubectl, the dashboard is a great addition.
Supported Chaos Scenarios
Chaos Mesh supports many scenarios, including:
- PodChaos - Kill pods or inject container failures
- NetworkChaos - Network latency, packet loss, network partition
- DNSChaos - DNS resolution failures
- HTTPChaos - HTTP delays and response injection
- StressChaos - CPU and Memory stress
- IOChaos - Disk I/O latency and failures
- TimeChaos - System clock manipulation
- KernelChaos - Kernel-level fault injection
This allows you to validate not only your application but also the infrastructure it depends on.
RBAC Support
Not everyone should be able to launch chaos experiments, especially in production environments. Chaos Mesh integrates with Kubernetes RBAC, so only authorized users can create and run experiments.
Workflow & Schedule
Real incidents rarely consist of a single failure. With Chaos Mesh, you can:
- Run experiments sequentially
- Execute multiple experiments simultaneously
- Schedule experiments to run automatically
This makes it much easier to simulate realistic failure scenarios.
Architecture
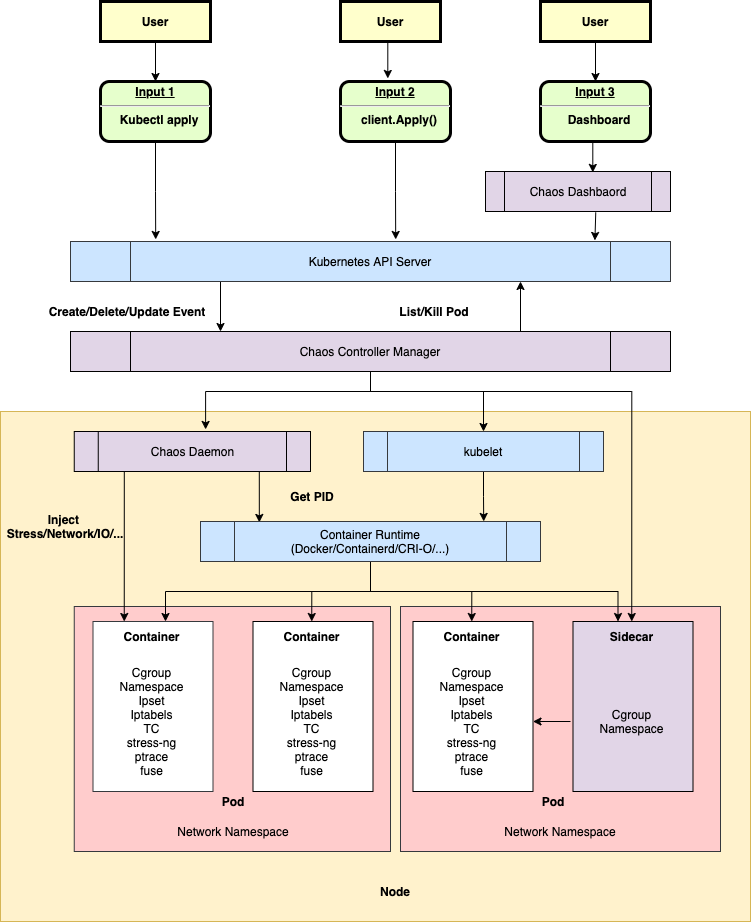
Chaos Mesh has three core components.
Chaos Dashboard
This is the web interface users interact with. Users create, start, stop, and monitor experiments here.
Chaos Controller Manager
Think of this as Chaos Mesh's brain. It watches the custom resources, schedules experiments, and coordinates all other components.
Chaos Daemon
This is the component that actually injects failures. Running as a DaemonSet on every node, it enters the target pod's namespace whenever necessary and performs operations such as modifying networking, filesystem behavior, or even kernel-level functionality.
Demo
For this demo, I'll use a local Kind Cluster, but the same steps work on Minikube or any Kubernetes cluster.
Install Chaos Mesh
curl -sSL https://mirrors.chaos-mesh.org/v2.8.1/install.sh | bash -s -- --local kindInstall Metrics Server
We'll need Metrics Server to observe CPU and Memory usage.
kubectl apply -f https://github.com/kubernetes-sigs/metrics-server/releases/latest/download/components.yamlIf you're using Kind or Minikube, don't forget the following configuration.
kubectl edit deployment metric-server -n kube-systemcontainers:
args:
- --kubelet-insecure-tlsAccess the Dashboard
kubectl port-forward svc/chaos-dashboard -n chaos-mesh 8080:2333Then open: http://localhost:8080
Deploy the Demo Application
apiVersion: v1
kind: Namespace
metadata:
  name: demo
---
apiVersion: apps/v1
kind: Deployment
metadata:
  name: nginx
  namespace: demo
spec:
  replicas: 2
  selector:
    matchLabels:
      app: nginx
  template:
    metadata:
      labels:
        app: nginx
    spec:
      containers:
        - name: nginx
          image: nginx
          resources:
            requests:
              cpu: 100m
              memory: 128Mi
            limits:
              cpu: 200m
              memory: 256Mi
---
apiVersion: v1
kind: Service
metadata:
  name: nginx
  namespace: demo
spec:
  type: ClusterIP
  selector:
    app: nginx
  ports:
    - port: 80
      targetPort: 80
      protocol: TCP
---
apiVersion: autoscaling/v2
kind: HorizontalPodAutoscaler
metadata:
  name: nginx-hpa
  namespace: demo
spec:
  scaleTargetRef:
    apiVersion: apps/v1
    kind: Deployment
    name: nginx
  minReplicas: 2
  maxReplicas: 5
  metrics:
  - type: Resource
    resource:
      name: cpu
      target:
        type: Utilization
        averageUtilization: 50
kubectl apply -f demo.yaml
Scenario 1 - Pod Kill
Let's start with the most common scenario.
apiVersion: chaos-mesh.org/v1alpha1
kind: PodChaos
metadata:
  name: pod-kill-demo
  namespace: demo
spec:
  action: pod-kill
  mode: all
  selector:
    namespaces:
      - demo
    labelSelectors:
      app: nginx
  duration: "60s"
kubectl apply -f kill-pod.yaml
kubectl get pod -n demo -wHere we can watch Kubernetes' self-healing capability in action. The pod is deleted, and the Deployment immediately creates a replacement.
Scenario 2 - Network Delay
Now let's introduce artificial network latency.
apiVersion: chaos-mesh.org/v1alpha1
kind: NetworkChaos
metadata:
  name: network-delay-demo
  namespace: demo
spec:
  action: delay
  mode: all
  selector:
    namespaces:
      - demo
    labelSelectors:
      app: nginx
  delay:
    latency: "3000ms"
    correlation: "100"
    jitter: "0ms"
  duration: "30s"
kubectl apply -f network-delay.yaml
kubectl run curl --image=curlimages/curl -it --rm -- sh
curl nginx.demo.svc.cluster.localYou'll notice the requests become noticeably slower.
Scenario 3 - CPU Stress
apiVersion: chaos-mesh.org/v1alpha1
kind: StressChaos
metadata:
  name: cpu-stress-demo
  namespace: demo
spec:
  mode: one
  selector:
    namespaces:
      - demo
    labelSelectors:
      app: nginx
  stressors:
    cpu:
      workers: 2
      load: 80
  duration: "60s"
kubectl apply -f cpu-stress.yaml
kubectl top pod -n demoThis experiment puts CPU pressure on the target pod, allowing you to observe increased resource consumption through Metrics Server.
Scenario 4 - DNS Failure
apiVersion: chaos-mesh.org/v1alpha1
kind: NetworkChaos
metadata:
  name: dns-port-loss
  namespace: demo
spec:
  action: loss
  mode: all
  selector:
    namespaces:
      - demo
  loss:
    loss: "100"
    correlation: "0"
  direction: to
  externalTargets:
    - "10.96.0.10"
  duration: "60s"
kubectl apply -f dns-fail.yaml
kubectl run dns-test \
--image=busybox:1.35 \
-n demo \
-it --rm --restart=Never -- sh
nslookup nginx.demo.svc.cluster.localThe service name will no longer resolve successfully, allowing you to test your application's DNS dependency.
Scenario 5 - Scheduled Pod Kill
apiVersion: chaos-mesh.org/v1alpha1
kind: Schedule
metadata:
  name: scheduled-pod-kill
  namespace: demo
spec:
  schedule: "@every 1m"
  type: PodChaos
  podChaos:
    action: pod-kill
    mode: one
    selector:
      namespaces:
        - demo
      labelSelectors:
        app: nginx
    duration: "20s"
kubectl apply -f scheduled-pod-kill.yamlIn this example, our pod will be automatically deleted at specified intervals.
Scenario 6 - Workflow
Finally, let's look at one of my favorite features.
apiVersion: chaos-mesh.org/v1alpha1
kind: Workflow
metadata:
  name: cascading-failure-workflow
  namespace: demo
spec:
  entry: chaos-sequence
  templates:
    - name: chaos-sequence
      templateType: Serial
      children:
        - pod-kill-step
        - network-delay-step
        - cpu-stress-step

    - name: pod-kill-step
      templateType: PodChaos
      deadline: 30s
      podChaos:
        action: pod-kill
        mode: one
        selector:
          namespaces:
            - demo
          labelSelectors:
            app: nginx

    - name: network-delay-step
      templateType: NetworkChaos
      deadline: 40s
      networkChaos:
        action: delay
        mode: all
        selector:
          namespaces:
            - demo
          labelSelectors:
            app: nginx
        delay:
          latency: "2000ms"
          correlation: "100"
          jitter: "0ms"

    - name: cpu-stress-step
      templateType: StressChaos
      deadline: 60s
      stressChaos:
        mode: one
        selector:
          namespaces:
            - demo
          labelSelectors:
            app: nginx
        stressors:
          cpu:
            workers: 2
            load: 80
kubectl apply -f workflow.yamlIn real production environments, failures rarely happen one at a time. A network slowdown may be followed by CPU spikes, which may eventually trigger pod restarts. With Workflow, it's very easy to chain these failures together and create realistic resilience tests.
Final Thoughts
At first, Chaos Engineering may sound a little scary because you're intentionally breaking your own system. But that's not really the goal.
The real goal is to understand how your applications behave before real users experience those failures.
My recommendation is to start small. Start with Pod Kill, then try Network Delay and CPU Stress, and gradually combine them using Workflows.
If you're running critical workloads on Kubernetes, Chaos Mesh is definitely a tool worth exploring.