 ·
5 minute read
·
5 minute read
In the previous article in this series, we built a complete log pipeline using Fluent Bit as the collector and Grafana Loki as the storage backend. In this article, we will look at another common approach: shipping Kubernetes logs with Filebeat to Elasticsearch and visualizing them in Kibana, all deployed through the Elastic Cloud on Kubernetes (ECK) Operator.
Compared to the Fluent Bit and Loki setup from the previous article, this stack trades Loki's label-based, low-cardinality storage model for Elasticsearch's full-text indexing and richer query capabilities - at the cost of higher resource usage and operational overhead. Which one fits your environment best usually comes down to query patterns, retention requirements, and how much infrastructure you're willing to run.
In practice, reach for Elasticsearch and ECK when you need powerful full-text search, complex ad-hoc queries, or correlation across large volumes of log data. If your priority is lightweight, cost-efficient log aggregation with simple label-based filtering, Loki remains the better fit.
What We Will Build
We will deploy the ECK operator on a local Minikube cluster, then use the eck-stack Helm chart to spin up a quickstart Elasticsearch cluster and Kibana instance. Filebeat will run as a DaemonSet on every node, tailing container logs, enriching them with Kubernetes metadata, and shipping them into Elasticsearch. We will also configure Filebeat to collect logs only from pods matching specific labels, keep unrelated workloads out of our indices, and show how to drop unwanted fields from log records before they are indexed. Finally, we will use Kibana's Discover view to confirm that logs from our sample application are flowing end to end.
Demo
Deploy Minikube
minikube start
Install the ECK Operator
The ECK operator is a Kubernetes operator that manages the full lifecycle of Elasticsearch, Kibana, and other Elastic Stack components as native Kubernetes resources. We install it once cluster-wide, and it handles provisioning and reconciling Elastic resources for us.
# Add the Elastic Helm Repository
helm repo add elastic https://helm.elastic.co && helm repo update
# Install the ECK Operator cluster-wide
helm upgrade --install elastic-operator elastic/eck-operator -n elastic-system --create-namespace
Install the ECK Stack (Elasticsearch + Kibana + Filebeat)
With the operator running, we can now request an Elasticsearch cluster and a Kibana instance simply by installing the eck-stack chart. This chart wraps the Elasticsearch, Kibana, and Filebeat custom resources that the operator watches and reconciles.
eck-stack-values.yaml
eck-elasticsearch:
  fullnameOverride: elasticsearch
  version: 9.3.1
  nodeSets:
  - name: default
    count: 1
    config:
      node.store.allow_mmap: false
    volumeClaimTemplates:
    - metadata:
        name: elasticsearch-data
      spec:
        accessModes:
        - ReadWriteOnce
        resources:
          requests:
            storage: 5Gi

eck-kibana:
  fullnameOverride: kibana
  version: 9.3.1
  spec:
    count: 1
    elasticsearchRef:
      name: elasticsearch
    http:
      tls:
        selfSignedCertificate:
          disabled: true
      service:
        spec:
          type: ClusterIP
    podTemplate:
      spec:
        containers:
        - name: kibana
          env:
            - name: NODE_OPTIONS
              value: "--max-old-space-size=2048"
          resources:
            requests:
              memory: 1Gi
              cpu: 0.5
            limits:
              memory: 2.5Gi
              cpu: 2

eck-beats:
  enabled: true
  fullnameOverride: filebeat
  spec:
    type: filebeat
    version: 9.3.1
    elasticsearchRef:
      name: elasticsearch
    kibanaRef:
      name: kibana
    config:
      logging.level: debug
      logging.selectors: ["elasticsearch"]
      filebeat.autodiscover.providers:
        - type: kubernetes
          node: ${NODE_NAME}
          hints.enabled: true
          hints.default_config.enabled: false
      processors:
        - add_cloud_metadata: {}
        - add_host_metadata: {}
        # - drop_fields:
        #     fields:
        #       - "host.os"
        #       - "host.mac"
        #       - "host.architecture"
        #       - "host.id"
        #       - "kubernetes.node.labels"
        #       - "kubernetes.namespace_labels"
        #       - "kubernetes.namespace_uid"
        #       - "log.file"
        #       - "log.offset"
        #       - "input"
        #       - "ecs"
      ignore_missing: true
    daemonSet:
      podTemplate:
        spec:
          serviceAccountName: filebeat
          automountServiceAccountToken: true
          terminationGracePeriodSeconds: 30
          dnsPolicy: ClusterFirstWithHostNet
          containers:
            - name: filebeat
              securityContext:
                runAsUser: 0
                privileged: false
              env:
                - name: NODE_NAME
                  valueFrom:
                    fieldRef:
                      fieldPath: spec.nodeName
              volumeMounts:
                - name: varlogcontainers
                  mountPath: /var/log/containers
                  readOnly: true
                - name: varlogpods
                  mountPath: /var/log/pods
                  readOnly: true
                - name: varlibdockercontainers
                  mountPath: /var/lib/docker/containers
                  readOnly: true
          volumes:
            - name: varlogcontainers
              hostPath:
                path: /var/log/containers
            - name: varlogpods
              hostPath:
                path: /var/log/pods
            - name: varlibdockercontainers
              hostPath:
                path: /var/lib/docker/containers

extraObjects:
  - |
    apiVersion: v1
    kind: ServiceAccount
    metadata:
      name: filebeat
      namespace:
  - |
    apiVersion: rbac.authorization.k8s.io/v1
    kind: ClusterRole
    metadata:
      name: filebeat-
    rules:
      - apiGroups: [""]
        resources: ["namespaces", "pods", "nodes"]
        verbs: ["get", "list", "watch"]
      - apiGroups: ["apps"]
        resources: ["replicasets"]
        verbs: ["get", "list", "watch"]
      - apiGroups: ["batch"]
        resources: ["jobs"]
        verbs: ["get", "list", "watch"]
  - |
    apiVersion: rbac.authorization.k8s.io/v1
    kind: ClusterRoleBinding
    metadata:
      name: filebeat-
    subjects:
      - kind: ServiceAccount
        name: filebeat
        namespace:
    roleRef:
      kind: ClusterRole
      name: filebeat-
      apiGroup: rbac.authorization.k8s.io
This values.yaml deploys the full Elastic Stack on Kubernetes through ECK: a single-node Elasticsearch cluster with persistent storage handles indexing and search, Kibana connects to it over a TLS-free ClusterIP service for easy local access, and Filebeat runs as a DaemonSet on every node to tail container logs and ship them into Elasticsearch. Since all three components reference each other natively through ECK (elasticsearchRef, kibanaRef), authentication, service discovery, and TLS are wired up automatically, letting us focus on what to collect rather than how to connect the pieces together.
The filebeat.autodiscover.providers block uses Kubernetes autodiscover to automatically detect pods across the cluster. The key part is the combination of hints.enabled: true and hints.default_config.enabled: false: this means Filebeat does not collect logs from every pod by default. It only collects from pods that are explicitly annotated with co.elastic.logs/enabled: "true". In other words, instead of "collect everything automatically," the logic here is "only collect from pods that opt in."
helm repo add elastic https://helm.elastic.co && helm repo updatehelm upgrade --install ek-stack elastic/eck-stack -n elastic-stack --create-namespace -f eck-stack-values.yamlkubectl get pods -n elastic-stack -w
Retrieve the Elastic Superuser Password
ECK automatically creates a Kubernetes secret containing credentials for the built-in Elastic superuser.
kubectl get secret elasticsearch-es-elastic-user -o go-template=''
Port-Forward the Kibana Service
Navigate to https://localhost:5601 in your browser.
kubectl port-forward svc/kibana-kb-http 5601:5601 -n elastic-stack
Deploy Sample Log Pod
To verify the pipeline end-to-end, we deploy the same kind of sample application used in the previous article: a small container that continuously emits JSON-formatted logs alternating between info and warn levels.
log-generator.yaml
apiVersion: v1
kind: Pod
metadata:
  name: log-generator
  namespace: app
  labels:
    app: log-generator
  annotations:
    co.elastic.logs/enabled: "true"
spec:
  containers:
    - name: log-generator
      image: busybox
      command: ["sh", "-c"]
      args:
        - |
          while true; do
            echo "{\"level\":\"info\",\"message\":\"hello from log-generator\",\"timestamp\":\"$(date -u +%Y-%m-%dT%H:%M:%SZ)\"}"
            sleep 3
            echo "{\"level\":\"warn\",\"message\":\"something might be wrong\",\"timestamp\":\"$(date -u +%Y-%m-%dT%H:%M:%SZ)\"}"
            sleep 3
          done
Note the co.elastic.logs/enabled: "true" annotation on the pod. Since we configured Filebeat's autodiscover with hints.default_config.enabled: false, this annotation is what tells Filebeat to actually collect logs from this pod. Without it, log-generator would run normally, but its logs would simply be ignored by the autodiscover provider.
kubectl create ns app
kubectl apply -f log-generator.yaml -n app
kubectl logs -f log-generator -n app
Verify Logs in Kibana
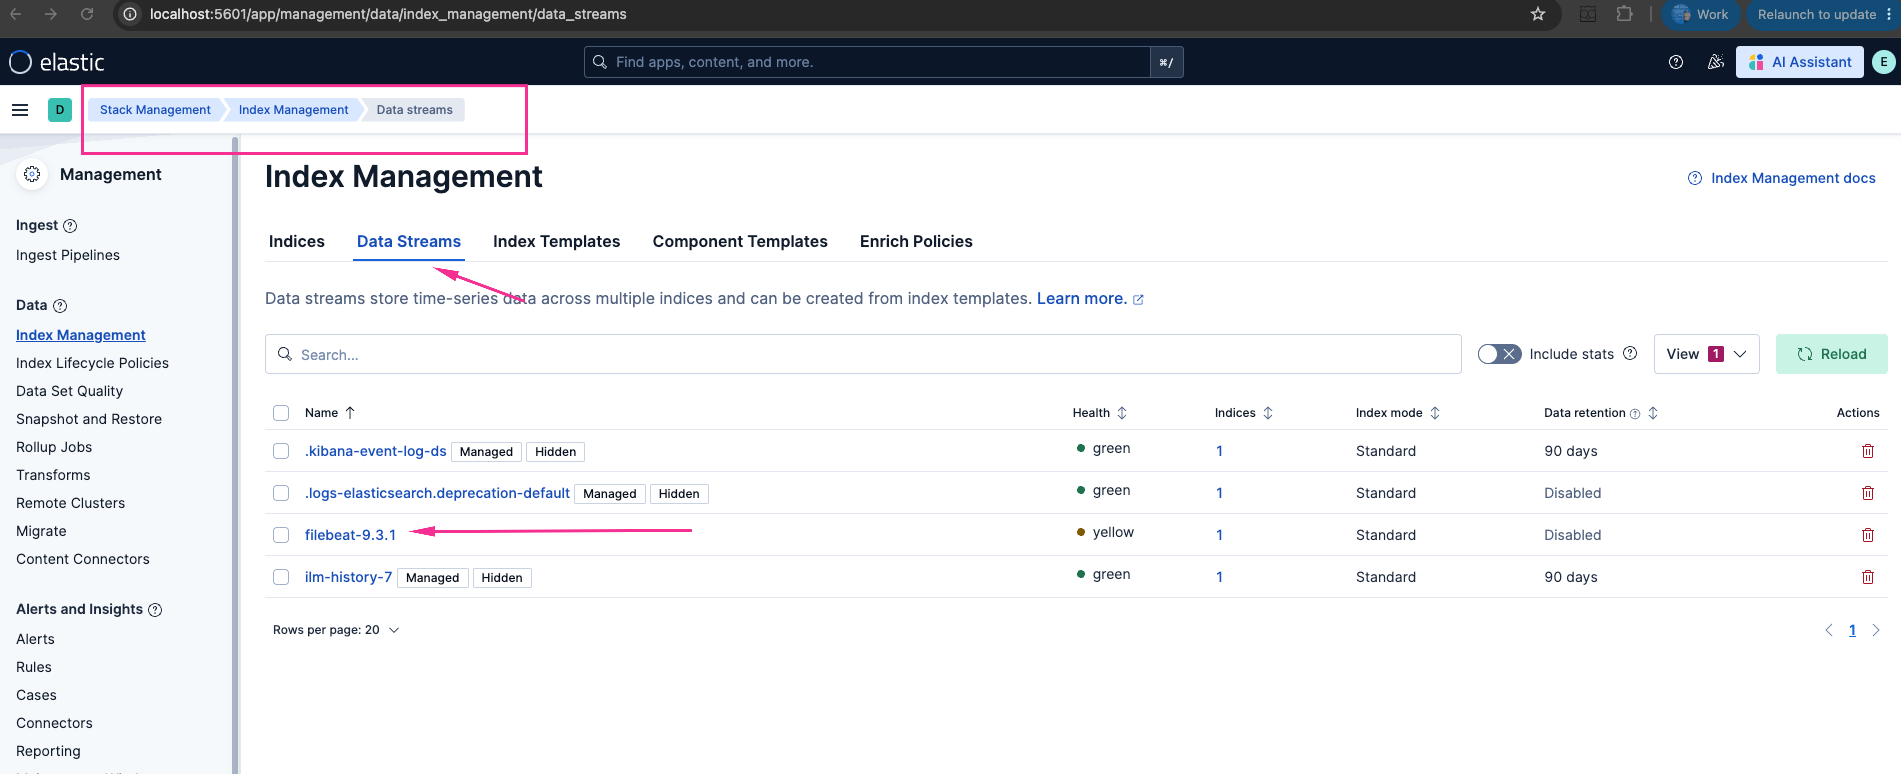
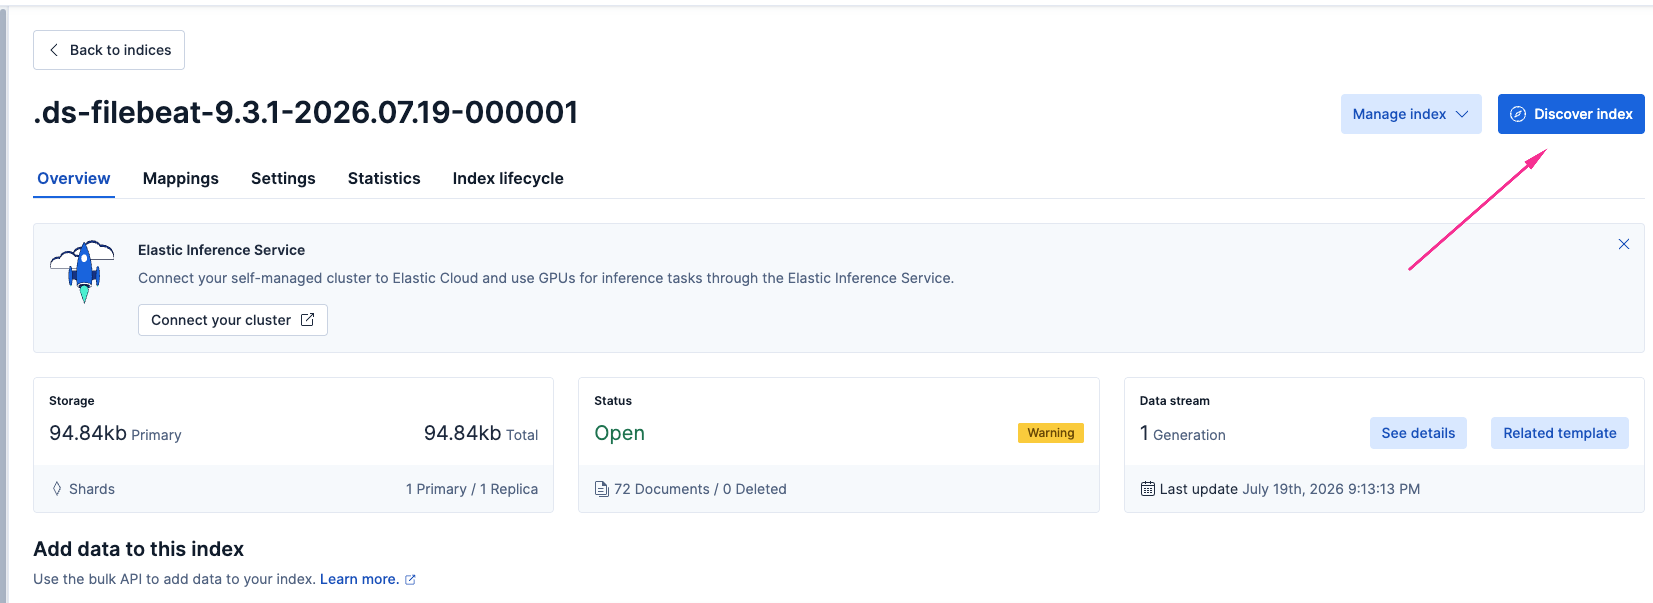
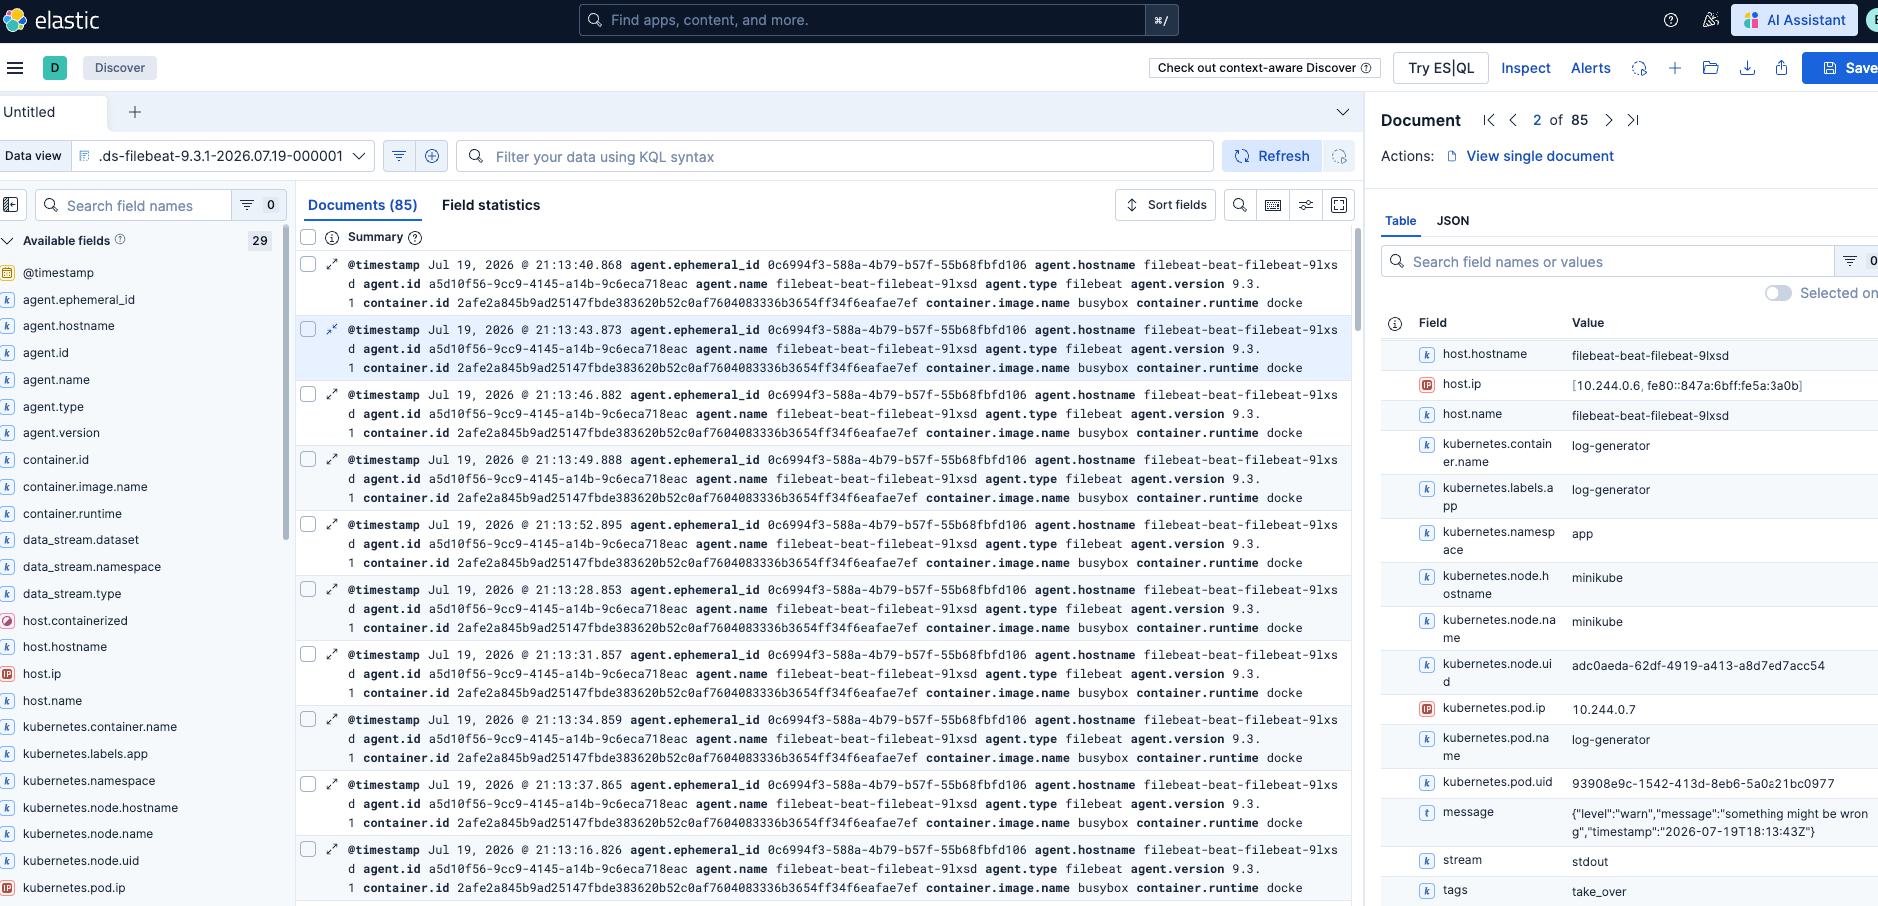
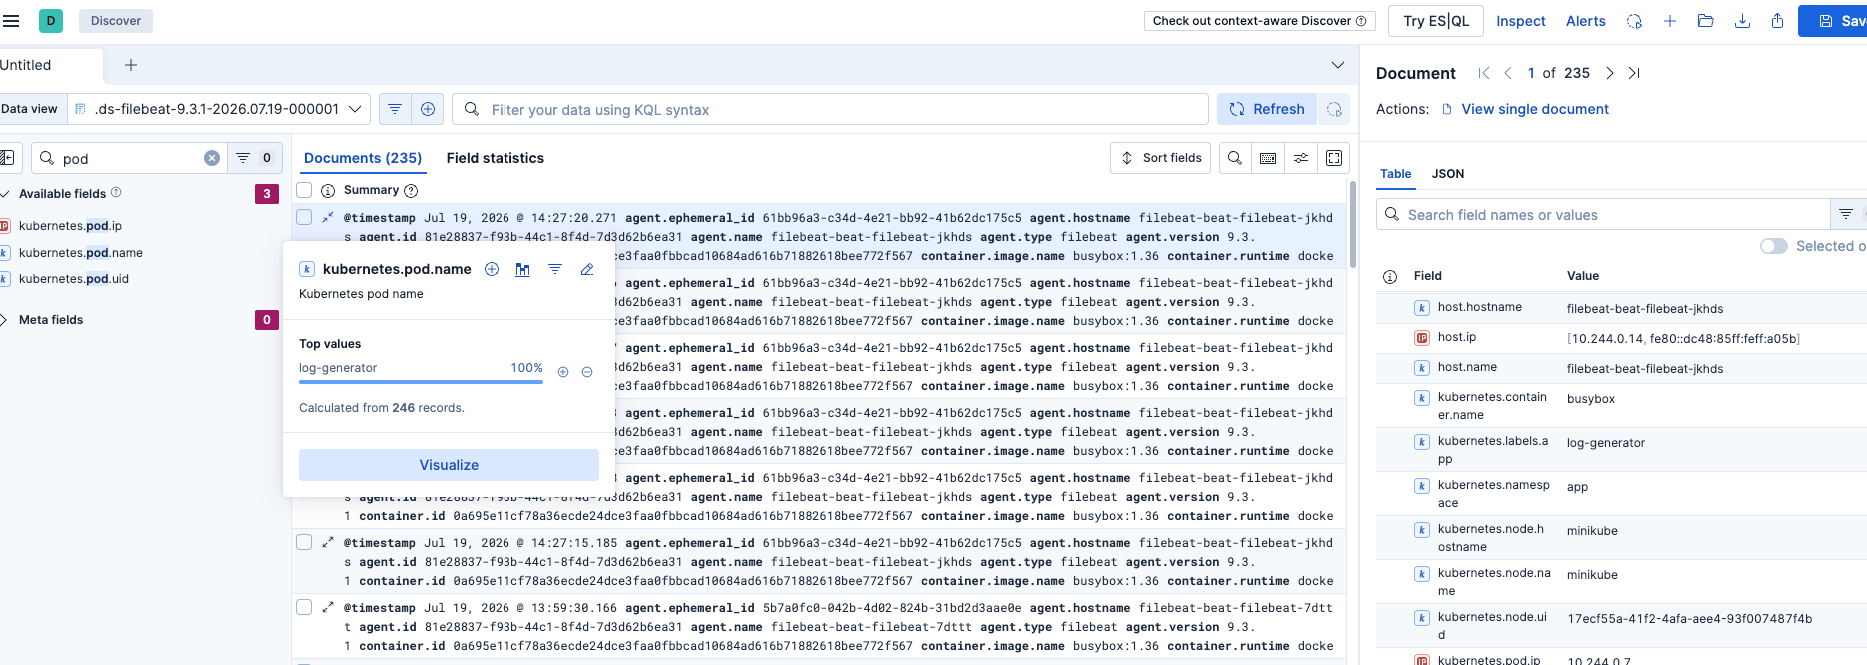
Once the pod is running, open Kibana and go to Stack Management > Index Management to confirm that the filebeat-* datastream has been created and is receiving documents. Then head to Discover, create a data view for filebeat-* if one doesn't already exist, and filter by kubernetes.namespace or kubernetes.pod.name to confirm the log-generator's messages are showing up correctly with their level and message fields parsed out.
Dropping Unwanted Fields
You'll notice the drop_fields processor in eck-stack-values.yaml is commented out by default. Before applying it, take a look at a log document in Kibana's Discover view and you'll see extra fields like host.os, host.mac, kubernetes.node.labels, log.offset, and ecs cluttering every record - none of which add real value for our use case. Uncomment the drop_fields block:
processors:
  - add_cloud_metadata: {}
  - add_host_metadata: {}
  - drop_fields:
      fields:
        - "host.os"
        - "host.mac"
        - "host.architecture"
        - "host.id"
        - "kubernetes.node.labels"
        - "kubernetes.namespace_labels"
        - "kubernetes.namespace_uid"
        - "log.file"
        - "log.offset"
        - "input"
        - "ecs"
Then apply the change:
helm upgrade --install ek-stack elastic/eck-stack -n elastic-stack --create-namespace -f eck-stack-values.yaml --force-conflictsOnce the Filebeat pods roll out with the updated configuration, go back to Discover and inspect a new log document. The fields listed above will no longer be present, leaving you with cleaner, smaller documents that are easier to read and cheaper to store.
Conclusion
In this article, we deployed the ECK operator to manage Elasticsearch and Kibana declaratively on Kubernetes, installed Filebeat as a DaemonSet to tail container logs, and restricted collection to a single namespace to keep our indices focused and cost-effective. We then verified the pipeline by generating sample logs and inspecting them in Kibana's Discover view.
In this demo, Elasticsearch was deployed as a single-node cluster inside the same Kubernetes cluster for simplicity and local testing. This setup is not suitable for production. For production workloads, Elasticsearch should run as a multi-node cluster with dedicated master, data, and ingest roles, sized properly for your log volume and retention needs.